BI Dashboard Items Layout
The BI Dashboard Designer provides the capability to arrange and resize dashboard items and groups in various ways, using simple drag-and-drop operations.
![]()
Layout Concepts
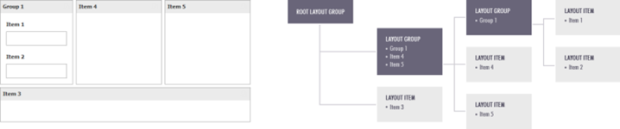
The dashboard arranges dashboard items and groups using layout items and layout groups. They are special containers that are used to present a dashboard layout as a hierarchical structure.
-
A layout item is used as a container that displays an individual dashboard item.
-
A layout group is used as a container that is used to arrange layout items (or other layout groups) either horizontally or vertically. At the same time, layout groups are used as containers that display dashboard item groups.
Thus, a dashboard layout is hierarchically arranged from the root layout group to bottommost layout items, which display individual dashboard items.
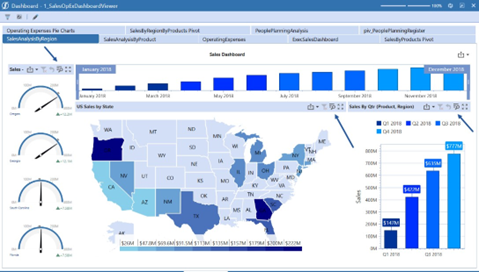
Dashboard Title
The Dashboard Title is located at the top of the Dashboard. The dashboard title can contain text or image content, elements selected in the master filter item and command buttons.
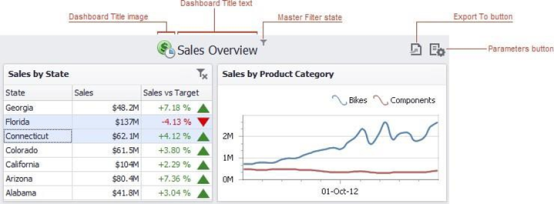
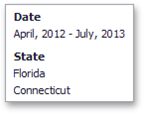
When you hover over the filter icon, all master filters applied to the dashboard are displayed in the invoked pop-up.
The dashboard title can contain the following command buttons:
-
Export To button (the
 icon) allows you to print/export the dashboard. To learn more about printing and exporting, see the Printing and Exporting topic.
 -
Parameters button (the
 icon) allows you to modify dashboard parameter values. To learn how to modify dashboard parameter values, see the Requesting Parameter Values topic.
Dashboard Item Caption
Each dashboard item has a caption that is displayed at the top of this item. The caption contains static text along with other information, as well as command buttons.
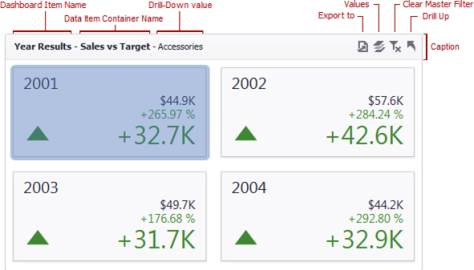
The caption of the Dashboard item contains the following information and buttons, depending on the dashboard item type:
-
Dashboard Item Name: Represents the static text within a dashboard item's caption
-
Data Item Container Name: Represents the name of the data item container
-
Drill-Down Value: Shows value(s) from the current drill-down hierarchy
-
Export To Button: Allows you to print or export a dashboard item
-
Values Button: Invokes a drop-down menu that allows you to switch between provided values (in the pie, card, gauge and map dashboard items)
-
Clear Master Filter Button: Allows you to reset filtering when a dashboard item acts as the Master Filter
-
Drill Up Button: Allows you to return to the previous detail level when the drill-down capability is enabled for this item
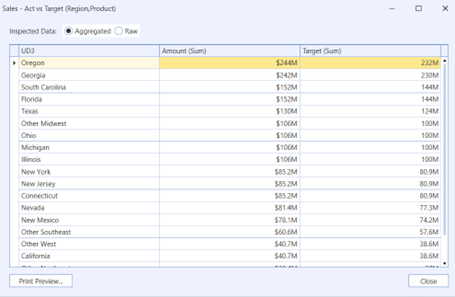
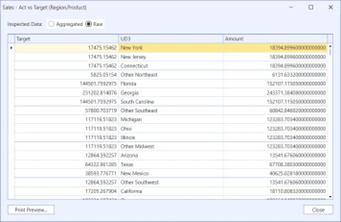
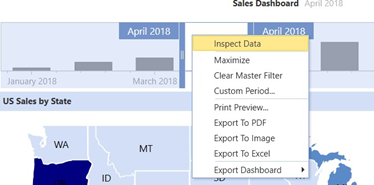
Inspect Data
You can review your underlying data from your visualization in an aggregated or raw data view and create quick reports which can be exported to multiple formats.
1. Click Inspect Data from a Dashboard or from the BI Designer to open the Data Inspector window.
2. Click Aggregated to review the data that is retrieved from the dashboard item's data.
3. Click Raw to review the data from the dashboard item's underlying data.
4. You can also right-click for the Inspect Data menu option.
Item Resizing
You can resize individual items/groups of items by dragging their edges.
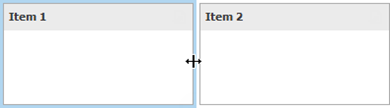
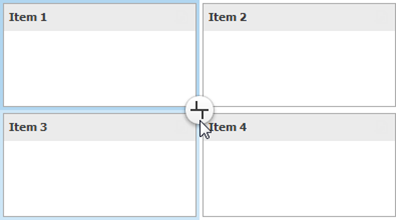
By default, a 2x2 layout group of dashboard items is horizontally oriented and contains two child layout groups. This arranges dashboard items in two 'columns' and allows you to set a different height for items in different columns. You can switch the orientation of the 2x2 group to Vertical using the indicator at the group intersection.
Item Positioning
You can change the position of a dashboard item by using drag-and-drop and one of the following approaches:
-
If the caption of the dashboard item is visible, click it and hold down the left mouse button while dragging the item.
-
If the caption of the dashboard item is not visible, click the icon in the top left corner, and hold down the left mouse button while dragging the item.