Dashboards
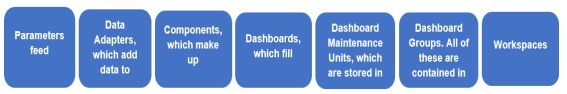
Dashboards are a powerful way for users to view formatted cube views, pixel perfect financial reports and expressive charts. Dashboards are contained in a dashboard group and comprised of components, data adapters and potentially parameters. All of the objects are managed and shared across Dashboard Maintenance Units. Each is a building block on the other. Dashboard Maintenance Units are stored, created, and maintained in Workspaces. Workspaces vary by dashboard project needs and applications.
Workspaces store Dashboard Maintenance Units and facilitate community development by providing an isolated environment for developers to segregate and organize Dashboard objects. Workspaces are the foundation for dashboards and will continue to evolve into the framework that encapsulates the artifacts needed to develop business solutions.
The main use of a Dashboard Maintenance Unit is to enable the sharing of key dashboard artifacts like parameters, data adapters and components across multiple dashboard groups. These objects do not have security access settings, so they assume the settings of the maintenance unit. Once a maintenance unit is created, dashboard groups, components, data adapters, parameters, and files can be created within the unit.
Dashboard groups are created to organize dashboards and work as placeholder where the dashboards reside. The dashboard groups are then available to assign to dashboard profiles for viewing throughout the workflow process.
Dashboards are composed of components which are broken into parameter components, content components, and embedded components. Components can have one to many data adapters and can be used across multiple dashboards and dashboard groups in the same Dashboard Maintenance Unit.
When creating a component, give it a name and description. Feed parameters and other Substitution Variables into the description, so they display in the resulting component.
Account: |!TrendAccountParam!| Region: |!!Region Parameter!!| Year: |WFYear| Will appear as:Account: Net Income Region: Asia Pacific Year: 2012
Data adapters are the minimum building block for components. These specify where the data is coming from for the dashboard component. A list can be made of each data adapter which names the resulting table created when the dashboard runs.
Parameters can be used to filter data in the resulting dashboard. They are not required, but extremely useful. See Presenting Data With Books, Cube Views and Dashboards.
The File section allows an administrator to create company specific dashboards by uploading documents and images.
NOTE: Optimal display size is 1920 x 1080 resolution. For the Windows desktop application, we recommend setting the scale to 100% and using the zoom functionality to zoom in. This is especially helpful in dashboards such as People Planning and Reporting Compliance.
The process works as follows: